Coadministration Among Pregnant Women ~ RSV Vaccine
Factors Associated with Co-Administration of Vaccines Among Pregnant Women Receiving the Respiratory Syncytial Virus (RSV) Vaccine
Group project completed with Lauren Dempsey and Nikki Ooley.
Introduction
Abryvso, a Respiratory Syncytial Virus (RSV) vaccine, was approved in 2023 by the U.S. Food and Drug Administration as the first approved RSV vaccine for pregnant women to protect against complications due to RSV infections for both the mother and their infant following birth. It is recommended by the Centers for Disease Control and Prevention (CDC) for pregnant women to be vaccinated for RSV between approximately 32 to 37 weeks gestation to optimize safety and effectiveness, and to be vaccinated from September to January to align with the seasonality of RSV. This time period aligns with recommendations for influenza and severe-acute-respiratory-syndrome-related coronavirus-2 (SARS-CoV-2 or COVID-19) vaccination, and the CDC also approves pregnant women to receive a co-administered influenza or SARS-CoV-2 vaccine alongside their RSV vaccine. There is little data on the safety and efficacy of co-administered RSV vaccinations among pregnant women, and no published research on the prevalence and factors associated with vaccine co-administration among pregnant women receiving the RSV vaccine. This project aims to define the prevalence of vaccine co-administration among pregnant women receiving the RSV vaccine and examine factors that might be associated with vaccine co-administration.
We utilized CDC’s voluntary vaccine surveillance network, V-SAFE, to obtain our sample of pregnant women who received the RSV vaccine.
- Research Question 1: Is the proportion of participants who received a co-administered vaccine less than that of adults overall? Analyzed using a one-sample proportion hypothesis test to determine the prevalence of co-administration among women receiving the RSV vaccine, compared to co-administration among the general adult population receiving vaccinations.
- Research Question 2: Is the expecting mother’s age group associated with receiving a co-administered vaccine? Analyzed using a chi-square test of independence to see if a higher proportion of certain age groups receive a co-administered vaccine.
- Research Question 3: Is the week of gestation at RSV vaccination associated with receiving a co-administered vaccine? Analyzed using a two-sample t-test to compare the timing of vaccination for women who were co-administered a vaccine to women who only received the RSV vaccine.
All data were analyzed using JMP. These results could inform public health outreach efforts for vaccination among pregnant women or future behavioral science studies on determinants of vaccine co-administration in this population.
Dataset & Description
Source
Our dataset, “V-safe RSV for Pregnant Women,” is from the Centers for Disease Control and Prevention (CDC)’s Open Data Portal, Data.CDC.gov. This data was listed under Vaccinations > Pregnancy and Vaccination and is managed by the National Center for Emerging and Zoonotic Infectious Diseases. V-Safe is a voluntary active surveillance system of the CDC and its purpose is to monitor side effects of authorized vaccines in the United States. The data in this dataset was self-recorded by study participants from 11/28/2023 to 3/23/2025.
Context
The data represents pregnant women who received a vaccine for respiratory syncytial virus (RSV) from 2023-2025. Since the V-SAFE program is voluntary and does not include a random sample of all pregnant women vaccinated with RSV, we are not focusing on the safety of the vaccine itself, since this is not a generalizable or representative sample. We instead compare descriptive and clinical characteristics of women who are getting the RSV vaccination and volunteer to be in the study.
Sample Size
The sample contains 1,389 respondents.
Variables
Table 1. Variable Descriptions and Anticipated Roles in Analysis
| Variable Name | Variable Type | Description | Anticipated Role in Analysis |
|---|---|---|---|
| VSAFE_SYSTEM_ID | Enrollment ID | 18 alpha-numeric (random) | Study ID |
| AGE_AT_VAX_YRS | Categorical | Age at vaccination age groupings in years (20-29, 30-39, or 40-49) | Explanatory variable |
| COADMINISTERED | Categorical | Other vaccines received on this date? (yes/no) | Response variable |
| weeks_gestation | Quantitative | Number of weeks vaccine was administered before estimated delivery date (defined as (Estimated Delivery Date − Vaccination Date) / 7) | Explanatory variable |
Exploratory Data Analysis
Vaccine Co-Administration (Yes/No)
Table 2. Frequency of Co-Administration of a Vaccine Alongside the RSV Vaccine (N = 1,389)
| Co-Administered Vaccine | N | % of Total |
|---|---|---|
| No | 1187 | 85.46% |
| Yes | 202 | 14.54% |
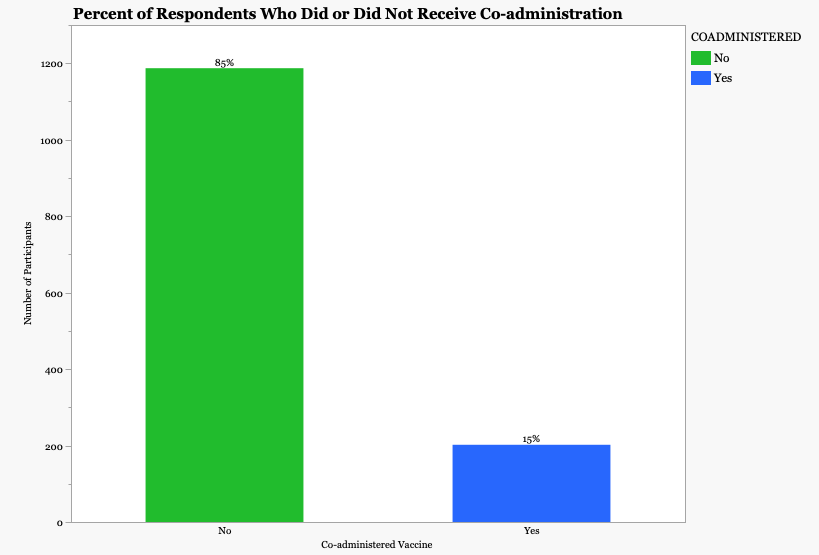
Observations: When asked if they had received co-administration of a vaccine alongside the RSV vaccine Abryvso, only 202 (14.54%) of respondents said “Yes.” The remaining 1,187 (85.46%) responded “No.” All 1,389 participants responded to this question, which is important since this is the primary outcome variable. This sample size is large enough to determine differences between these two groups, since the lowest proportion is about 15% (n = 202).
Age Group of Expecting Mother at Vaccination
Table 3. Distribution of Participant Age Group (N = 1,389)
| Age Group (Years) | N | % of Total |
|---|---|---|
| 20-29 | 195 | 14.04% |
| 30-39 | 1068 | 76.89% |
| 40-49 | 126 | 9.07% |
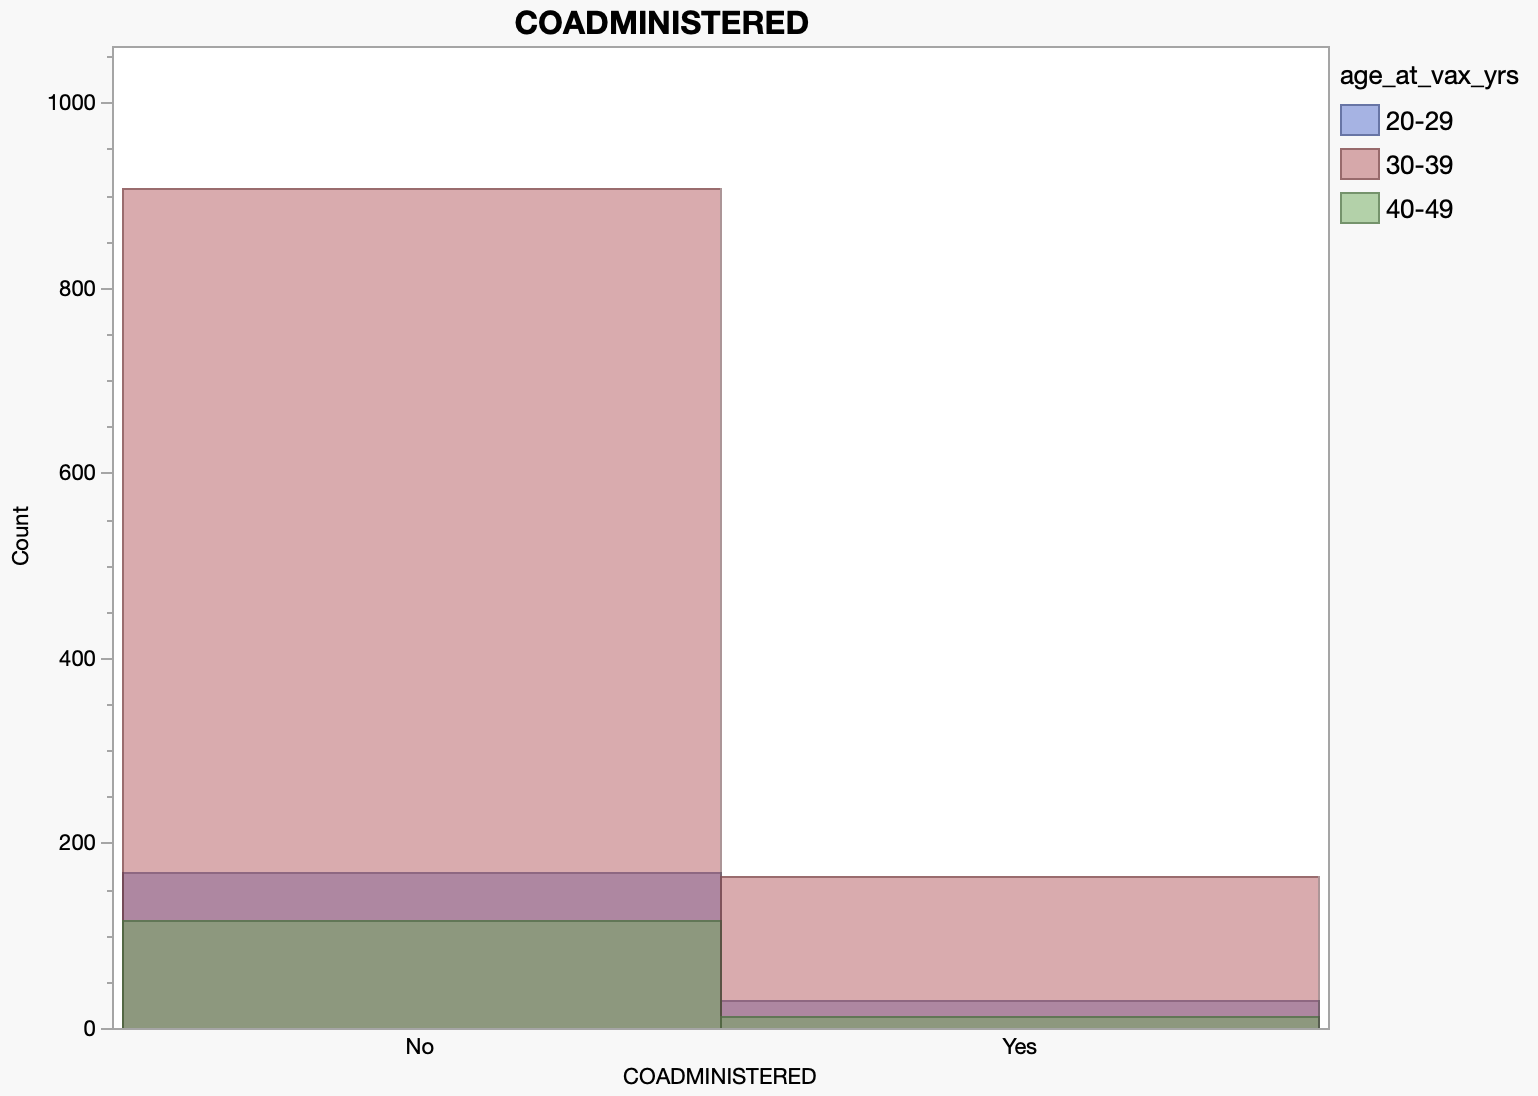
Observations: 76.89% of expecting mothers in the study are aged 30-39, the largest group, followed by 20-29 (14.04%) and 40-49 (9.07%). Though the majority of the sample falls in the 30-39 age range, the comparison groups are large enough to run analyses such as chi-square tests (>5% of the overall sample per group), so we don’t anticipate issues with this categorical variable.
Weeks Gestation at RSV Vaccination
Table 4. Numerical Summary for Number of Weeks Vaccine Was Administered Before Estimated Delivery Date
| Statistic | Value |
|---|---|
| Mean | 5.3079 |
| Median | 5 |
| Standard Deviation | 2.2061 |
| Standard Error Mean | 0.0592 |
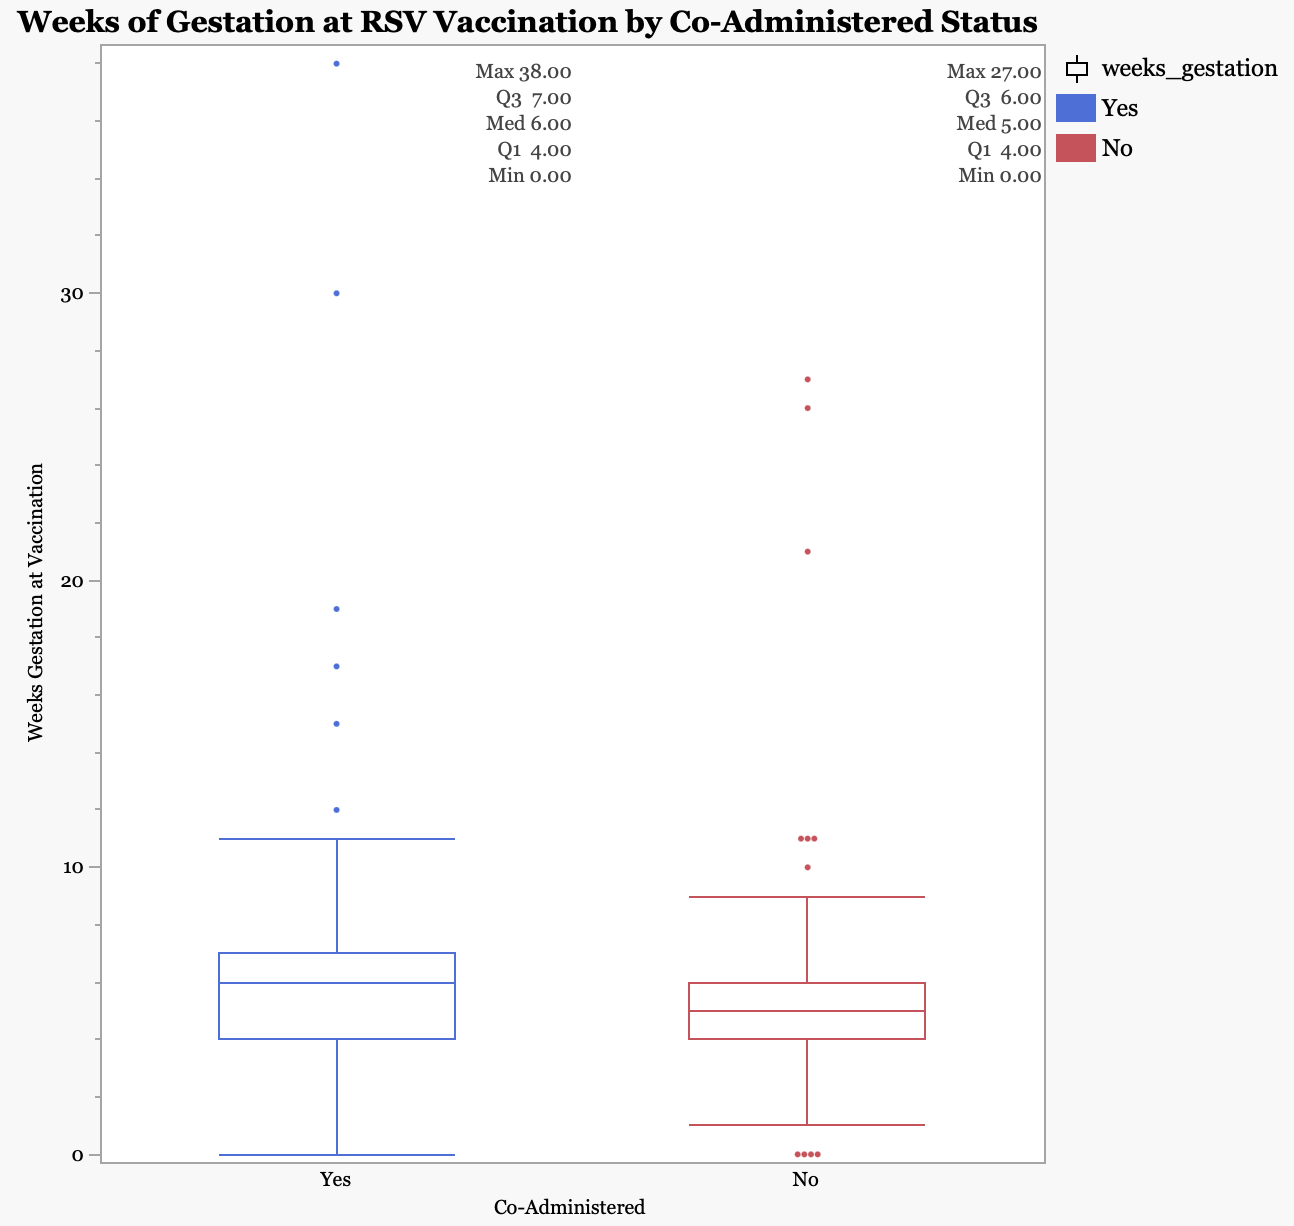
Observations: Responses for gestational age, measured in weeks from the expected delivery date at the time of RSV vaccination, were available for 1,387 participants, with a median gestational time of 5 weeks. The mean gestational time (\(\bar{x}\) = 5.3079) and standard deviation (s = 2.2061 weeks) suggest moderate variability around the median. Only 13 patients received an RSV vaccine more than 10 weeks before their estimated delivery date; even though these were identified as outliers (as seen in the figure), we included them in the analysis since these values were technically plausible (i.e., less than 40 weeks). Participants who answered “Yes” to receiving a co-administered vaccine had a higher median weeks_gestation (6.00) than those who answered “No” (5.0). The “Yes” group also has a slightly larger interquartile range (Q1 = 4.00, Q3 = 7.00) compared to the “No” group (Q1 = 4.00, Q3 = 6.00). Both groups are right-skewed with several outliers, where the “Yes” group has the greatest outlier value at 38 weeks of gestation compared to 27 weeks in the “No” group.
One-Variable Analysis
Method Justification
We generated a confidence interval for a proportion and a one-sample hypothesis test to address whether the proportion of participants who received a co-administered vaccine is less than that of adults overall. These approaches help assess (1) how precise the proportion in our sample is, and (2) whether the proportion of pregnant women in our sample who received a co-administered vaccine is significantly less than adults overall. These methods are appropriate because receiving a co-administered vaccine is recorded as categorical, requiring a proportion rather than a mean. For the one-sample hypothesis test, we compared our sample to a prior study of recently vaccinated adults where an estimated 35.7% of subjects received 2 or 3 vaccinations during their vaccination visit. Since there is no published value on co-administration of vaccines among pregnant women, we compared our sample to overall adults. Our hypotheses were:
\(H_0: p = 0.357\)
\(H_a: p < 0.357\)
We calculated a 95% confidence interval of the proportion estimate and set the significance level at \(\alpha = 0.05\).
Check Conditions
Randomization: The data does not satisfy the condition of randomization. Any pregnant woman in the United States who received the RSV vaccine had equal opportunity to enroll in the program, since the RSV vaccination information sheet given at time of administration included the link to volunteer for V-Safe. However, since patients were not randomized to participate or to a treatment (co-administration vs. no co-administration), this introduces biases that impact generalizability, such as self-selection bias from individuals who volunteered to participate (e.g., medical literacy or education). More detail is provided in the Interpretation in Context section and the Conclusion.
Normality: The data satisfies the condition of normality (\(np \geq 15\) and \(n(1-p) \geq 15\)), ensuring the sampling distribution of the sample proportion is nearly normal. The sample size (N = 1,389) and \(p_0\) (0.357) satisfy this condition since \(1{,}389 \times 0.357 = 495.873 \geq 15\) and \(1{,}389 \times (1-0.357) = 893.127 \geq 15\).
JMP Output and Visualizations
Table 5. Estimated Proportion Confidence Interval (95% Confidence Level): Vaccine Co-Administration Among Pregnant Women Receiving the RSV Vaccine, 2022–2025, N = 1,389
| Result | Value |
|---|---|
| Estimated Proportion | 0.14543 |
| Standard Error of Proportion | 0.00946 |
| Lower Limit | 0.12689 |
| Upper Limit | 0.16397 |

Table 6. One-Sample Hypothesis Test (\(\alpha = 0.05\)): Vaccine Co-Administration Among Pregnant Women Receiving the RSV Vaccine vs. Adults Overall (\(p_0\) = 0.357), 2022–2025, N = 1,389
| Result | Value |
|---|---|
| Estimated Proportion | 0.1454 |
| Standard Error of Proportion | 0.0129 |
| z Critical Value | -1.6449 |
| Test Statistic | -16.4577 |
| Observed Significance (p-value) | <.001 |
Interpretation in Context
Since the p-value is less than \(\alpha = 0.05\), we reject the null hypothesis. There is enough evidence to conclude that the proportion of co-administered vaccination among pregnant women receiving the RSV vaccine in this sample is less than overall adults receiving a vaccine. We are also 95% confident the true percentage of pregnant women receiving the RSV vaccine who are co-administered another vaccine at the same visit is between 12.7% and 16.4%. Future research questions could explore factors associated with co-administration to better understand what is associated with lower vaccine co-administration (e.g., week of pregnancy, age group) in this subpopulation.
The generalizability of these findings does not extend beyond our sample due to lack of randomization. Approaches to address this in future analyses could include matching (co-administered to not co-administered on relevant characteristics) or adjusting for covariates such as number of previous pregnancies. However, even with such techniques, bias would remain that is impossible to fully address without randomization; future studies using randomized sampling would be needed to move closer toward causal inference.
Same-Type Two-Variable Analysis
This analysis addresses Research Question 2: Is the expecting mother’s age group associated with receiving a co-administered vaccine?
Method Justification
Because both variables are categorical, a chi-square test of independence was used, rather than a linear regression or correlation analysis, to evaluate whether there is a significant association between age group and vaccine co-administration.
\(H_0\): There is no association between age group and vaccine co-administration.
\(H_a\): There is an association between age group and vaccine co-administration.
Significance level: \(\alpha = 0.05\).
Check Conditions
Randomization: The data does not satisfy the requirement for randomization, since participation was entirely voluntary, as previously noted. Any pregnant woman receiving the RSV vaccine could choose to participate, meaning the sample was self-selected rather than randomly assigned or sampled.
Chi-Square: The smallest expected count was calculated by multiplying the smallest row and column totals and dividing by the overall sample size: \((202 \times 126)/1389 = 18.324\). Since this expected count is greater than 5, the conditions for using a chi-square approximation are met.
JMP Output and Visualizations
Table 7. Contingency Table of Age Group by Co-Administered Vaccine Status Among Pregnant Women Receiving the RSV Vaccine, 2022–2025, N = 1,389
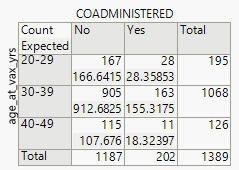
Table 8. Chi-Square Test of Independence (\(\alpha = 0.05\)) of Age Group by Co-Administered Vaccine Status Among Pregnant Women Receiving the RSV Vaccine, 2022–2025, N = 1,389
| Result | Value |
|---|---|
| Degrees of Freedom | 2 |
| Test Statistic | 3.875 |
| Observed Significance (p-value) | 0.1440 |
Interpretation and Context
Because the p-value is greater than \(\alpha = 0.05\), we fail to reject the null hypothesis. There is not enough evidence to conclude an association between age group and vaccine co-administration; differences observed in the sample could be attributed to random variation rather than a true association. We cannot conclude with confidence that age plays a meaningful role in whether participants received a co-administered vaccine alongside the RSV vaccine. Since the sample was also not randomized, the generalizability of these results does not extend beyond this sample, and a study with randomized sampling would be needed to explore this question further.
Different-Type Two-Variable Analysis
This analysis addresses Research Question 3: Is the week of gestation at RSV vaccination associated with receiving a co-administered vaccine?
Method Justification
We selected an independent two-sample t-test to determine whether the number of weeks the RSV vaccine was administered prior to the estimated delivery date is associated with receiving a co-administered vaccine, comparing V-SAFE participants who did and did not receive co-administration.
\(H_0: \mu_{Yes} = \mu_{No}\)
\(H_a: \mu_{Yes} \neq \mu_{No}\)
where \(\mu_{Yes}\) represents the mean number of weeks before estimated delivery date at RSV vaccination among participants who received a co-administered vaccine, and \(\mu_{No}\) represents the same for those who did not, at significance level \(\alpha = 0.05\).
Check Conditions
For a standard two-sample t-test, the data should satisfy independence, randomization, constant variance, and normality of the sampling distributions.
Independent Groups: Satisfied — participants responded either “Yes” or “No,” with no third group, and responses did not influence each other.
Randomization: Not fully satisfied, and treated as a limitation. The V-Safe data come from self-selected, voluntary participants, so results are interpreted as descriptive of the participants rather than generalizable.
Normality: Generally satisfied aside from some outliers causing right skew, as shown in the normal quantile plot below (Figure 5) and in Figure 7 (referenced above). The central limit theorem suggests the sampling distribution of each group mean should be approximately normal given sufficiently large sample sizes.
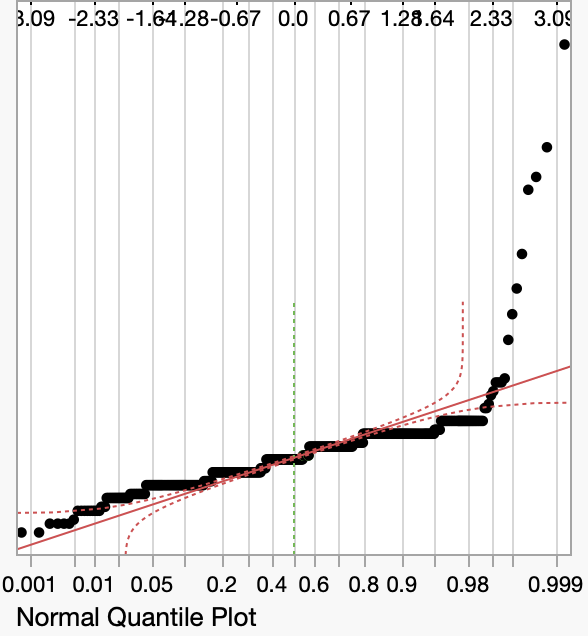
Constant Variance: We could not assume constant variance due to the large difference in standard deviations between groups (Yes: 3.6164, No: 1.8460). The Brown-Forsythe test p-value (0.0002) further indicates that constant variance cannot be assumed, and this is listed as a limitation.
JMP Output and Visualizations
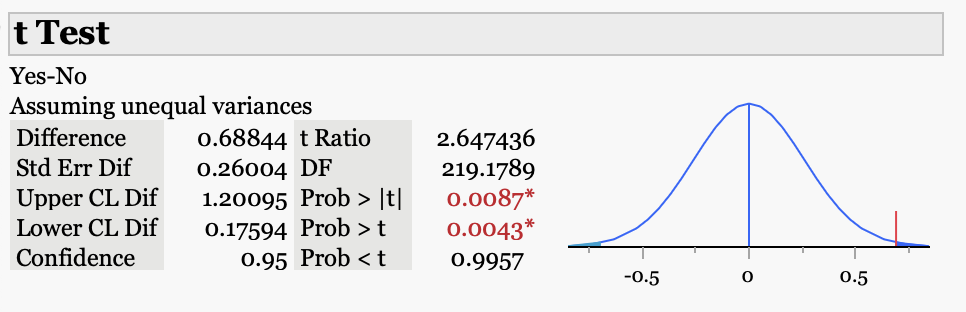
Figure 6. Two-sample t-test results, assuming unequal variances
Interpretation in Context
Our p-value (0.0087) is less than \(\alpha = 0.05\); we reject the null hypothesis and conclude that the mean number of weeks before delivery date at vaccine administration differs between women who did and did not receive co-administration. Women who received co-administration were vaccinated on average at 5.8960 weeks before delivery, compared to 5.2076 weeks for those who did not.
This difference (roughly 5 days) may not be biologically significant — statistical significance here largely reflects the large sample size’s ability to detect a small mean difference, rather than indicating that gestational timing meaningfully drives co-administration behavior. Since the recommended RSV vaccination window (~5 weeks) is much longer than five days, this statistically significant result is likely not clinically relevant.
It is also worth considering how outliers might affect these results. Women who received co-administration had more extreme outliers for weeks_gestation. Though plausible (< 40 weeks), some values (30 and 38 weeks from delivery) are far from clinical recommendations (3-8 weeks before delivery), raising the possibility of data entry error (e.g., participants interpreting the question as “weeks pregnant” rather than “weeks from delivery”). Since it is impossible to discern whether this reflects a data entry error, we retained these outliers in the analysis.
Conclusion & Future Directions
Across our three research questions on vaccine co-administration among respondents to the 2023–2025 V-Safe survey, subjects receiving the RSV vaccination were statistically less likely to receive co-administration of vaccines compared to adults overall (14.54% vs. 35.7%). Since our sample is self-selected, we cannot assume this reflects a population-level phenomenon.
Age was not significantly associated with co-administration status (p = 0.1440), so we cannot conclude that age is a meaningful determinant of co-administration in this subpopulation. There was evidence that the mean number of weeks before delivery at vaccine administration differed between those who did and did not co-administer (p = 0.0087); however, the roughly 5-day difference may be inflated by the large sample size or data entry error, and may not be biologically relevant or useful for public health outreach.
Future studies could explore whether vaccine co-administration relates to health-seeking behaviors prior to pregnancy, such as frequency of healthcare visits in the 12 months before pregnancy, socioeconomic factors, setting of vaccination (pharmacy vs. provider office), and patient attitudes toward vaccination (e.g., vaccine hesitancy). It would also be valuable to examine whether these patterns differ for women with high-risk or immunocompromising conditions. Larger, randomized, and more representative datasets would help determine whether trends observed in this V-SAFE sample hold at the population level.
References
- Morgan RL, Hanson KE, Armour A, et al. Maternal respiratory syncytial virus vaccination and prevention of respiratory syncytial virus disease in infants: a systematic review and meta-analysis. JAMA Netw Open. 2024;7(7):e2423128. doi:10.1001/jamanetworkopen.2024.23128.
- U.S. Food and Drug Administration. FDA approves first vaccine for pregnant individuals to prevent RSV in infants. Published August 21, 2023. fda.gov
- Centers for Disease Control and Prevention. RSV vaccine guidance for pregnant women. Updated August 30, 2024. cdc.gov
- Abu-Raya B, Giles ML, Kollmann TR. Co-administration of vaccines in pregnancy: unique challenges and knowledge gaps. Vaccine. 2025;60:127309. doi:10.1016/j.vaccine.2025.127309.
- V-safe RSV for Pregnant Women. Centers for Disease Control and Prevention. data.cdc.gov
- La, E. M., Sweeney, C., Davenport, E., & Bunniran, S. (2025). Pharmacy and healthcare provider offices as convenient adult vaccination settings in the US: Patient experiences from a survey of recently-vaccinated adults. Vaccine, 54, 127057. https://doi.org/10.1016/j.vaccine.2025.127057